COVID-19 has changed many things about the world. These experiences have convinced me of the importance of a basic statistical literacy for all citizens of the world. While there doesn’t appear to be a consensus definition for statistical literacy (Ziegler & Garfield, 2018), the definition that I mean here is something close to Wallman’s (1993) definition of an ability to understand and critically evaluate statistical information. I would argue that “statistical” isn’t an attribute of any information, but rather, it is an attribute of the way in which one processes and views any information. This is akin to Goodwin’s (1994) professional vision and practices of seeing frameworks.
So, how does a statistician view information related to COVID-19? I’ll present two examples of things that my colleagues and I saw in news stories (and knew that each other understood) that perhaps are not generally immediately obvious.
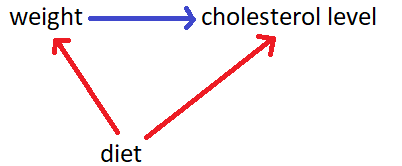
In April, Madagascar launched a herbal remedy for COVID-19. According to an article by the BBC, the Malagasy president’s communications director said, “The majority of people who used the product and don’t have a chronic illness recovered completely … as long as it’s working, we don’t need clinical trials.” What I immediately think of is the counterfactual – would those same people who used the product and recovered have recovered if they didn’t use the product? The quote has two clues – “the majority of people” implies that there are some who used the product and didn’t recover, and “don’t have a chronic illness” implies that this is describing individuals without comorbidities. According to a study by Ioannidis et al. (2020), which has not been peer-reviewed, “deaths for people <65 years without underlying predisposing conditions are remarkably uncommon.” Therefore, if the patients in Madagascar who did not have a chronic illness would have recovered even if they didn’t drink the herbal remedy, did the herbal remedy really do anything or have any effect? Even if the herbal remedy wasn’t working those patients would likely have gotten better. Therefore, this evidence (that most people without chronic illness who used the product recovered) does not support the claim (that the product works).
Around that same time, one of the first studies of Remdesivir was published. Wang et al. (2020) found, in a study where 158 patients were given Remdesivir against 79 given a placebo, that Remdesivir did not appear to improve time to recovery in patients. Shortly thereafter, Beigel et al. (2020) found, in a study with approximately 500 patients receiving Remdesivir and another 500 receiving a placebo, that Remdesivir did appear to slightly improve time to recovery. Which study is correct? Well, they both are. Each individual is unique, the way the disease progresses in each individual is unique, and the way Remdesivir affects each individual is unique. If we did ten studies with 100 patients, but 100 different patients each time, we wouldn’t get exactly the same results each time because the individuals in our study are different – this is called sampling variability. So if both these studies are correct, how do we combine their information? We can use a technique called meta-analysis. Simply, it seems that even if Remdesivir helps, it only helps a little bit. That’s still better than nothing, but as Beigel et al. (2020) note, “it is clear that treatment with [Remdesivir] alone is not likely to be sufficient.”
In both cases, what we statisticians saw were two clearly viable alternate explanations explaining observed phenomenon. Note that we didn’t react by saying the treatment doesn’t work, or that one of the studies is wrong – we acknowledged alternate competing theories being plausible, and therefore, to say a treatment works, we must first rule out these other competing theories – that there only appears to be a difference because of sampling variability, or that even if the treatment didn’t work we still would have seen this effect occur. These two alternate explanations are the core of our introductory statistics classes.
I hope all my students, and all individuals worldwide, process information by the following maxims:
- Accept uncertainty – it is ubiquitous, and statistics helps us to quantify our uncertainty.
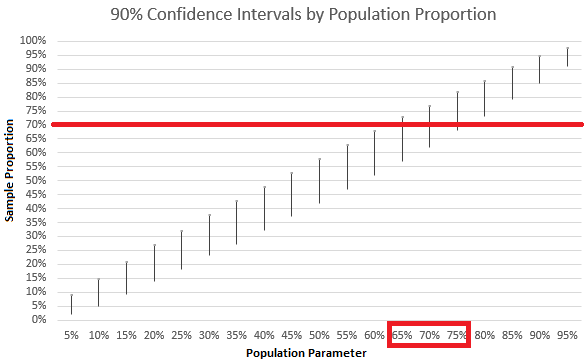
- Acknowledge variability – particularly in the form of sampling variability, which casts uncertainty upon our estimates.
- Ask the counterfactual – in order to say that one thing caused something to happen, you should also demonstrate that what happened would not have happened without that thing.
References:
Beigel, J. H., Tomashek, K. M., Dodd, L. E., Mehta, A. K., Zingman, B. S., Kalil, A. C., … & Lopez de Castilla, D. (2020). Remdesivir for the treatment of Covid-19—preliminary report. New England Journal of Medicine.
Goodwin, C. (1994). Professional Vision. American Anthropologist, 96(3), 606-633.
Ioannidis, J. P., Axfors, C., & Contopoulos-Ioannidis, D. G. (2020). Population-level COVID-19 mortality risk for non-elderly individuals overall and for non-elderly individuals without underlying diseases in pandemic epicenters. medRxiv.
Wallman, K., K. (1993). Enhancing statistical literacy: Enriching our society. Journal of
the American Statistical Association, 88(421), 1–8.
Wang, Y., Zhang, D., Du, G., Du, R., Zhao, J., Jin, Y., … & Hu, Y. (2020). Remdesivir in adults with severe COVID-19: a randomised, double-blind, placebo-controlled, multicentre trial. The Lancet.
Ziegler, L., & Garfield, J. (2018). Developing a statistical literacy assessment for the modern introductory statistics course. Statistics Education Research Journal, 17(2), 161-178.